Introduction
Environmental, Social and Governance (ESG) performance cannot be managed effectively without reliable measurement. Companies may have sustainability policies, climate commitments, employee programmes and governance frameworks, but without measurable Key Performance Indicators (KPIs), it is difficult to determine whether those initiatives are actually producing results.
ESG KPIs convert sustainability objectives into measurable business information. They help boards, management, investors, lenders, employees, customers and regulators understand how a company is performing against its environmental, social and governance priorities.
The International Sustainability Standards Board (ISSB) framework places metrics and targets alongside governance, strategy and risk management as one of the four core areas of sustainability-related financial disclosure. Companies are expected to disclose material information and relevant metrics relating to sustainability-related risks and opportunities.
There is no universal list of KPIs that every company must report. The appropriate indicators depend on the company’s industry, business model, material risks, regulatory requirements and stakeholder expectations. Industry-specific metrics are particularly important because sustainability risks differ significantly across sectors.
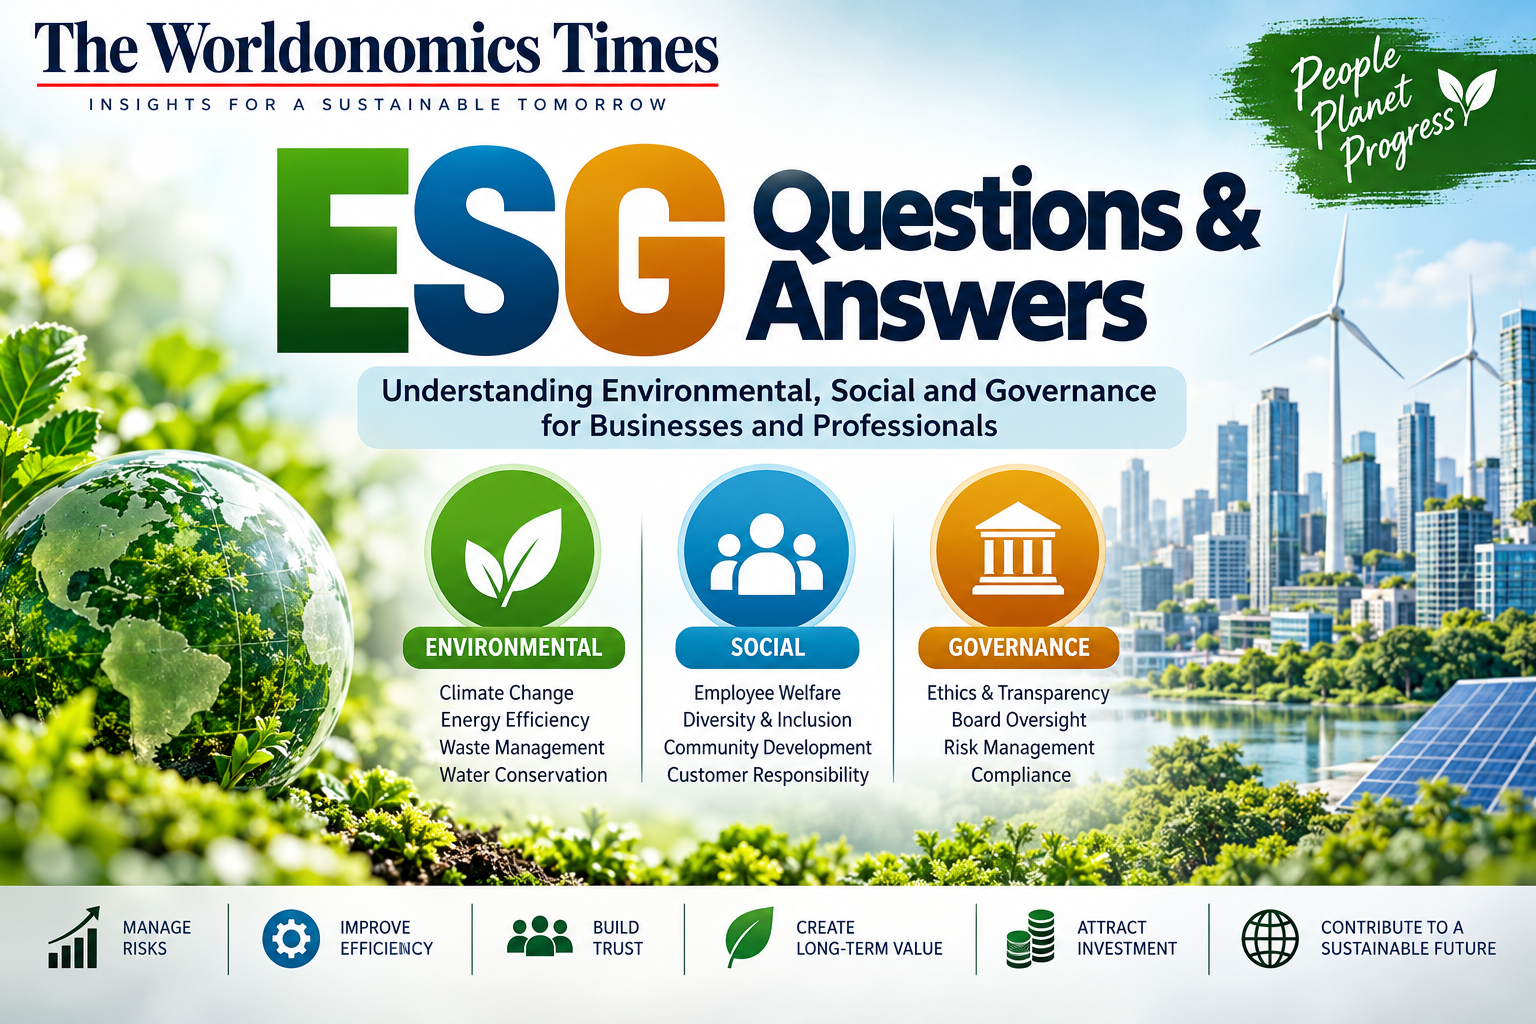
Below are 50 important ESG KPIs that companies can consider.
Environmental KPIs
1. Scope 1 GHG Emissions
Measures direct greenhouse gas emissions from sources owned or controlled by the company, such as company vehicles, boilers and manufacturing equipment.
Common unit: tonnes of CO₂ equivalent (tCO₂e).
2. Scope 2 GHG Emissions
Measures indirect emissions associated with purchased electricity, steam, heating or cooling.
Companies should establish appropriate measurement methods and maintain consistent methodologies.
3. Scope 3 GHG Emissions
Measures indirect emissions throughout the company’s value chain, including purchased goods, transportation, employee commuting, business travel, use of sold products and end-of-life treatment.
Scope 3 can be particularly significant for companies with complex supply chains. The GHG Protocol classifies Scope 3 emissions across 15 categories.
4. Total GHG Emissions
Tracks the company’s overall greenhouse gas emissions in tonnes of CO₂e.
This KPI provides management with a consolidated view of climate impact.
5. GHG Emissions Intensity
Measures emissions relative to an appropriate business denominator.
Examples include:
- tCO₂e per ₹1 crore revenue
- tCO₂e per tonne of production
- tCO₂e per employee
- tCO₂e per unit sold
Intensity indicators can help compare performance across periods despite changes in business size.
6. Renewable Energy Consumption
Measures the amount or percentage of energy obtained from renewable sources.
Example KPI: Renewable energy as % of total energy consumption.
7. Energy Consumption
Tracks total energy used by the organisation.
It can be reported in:
- kWh
- MWh
- GJ
Energy consumption should ideally be monitored by facility, business unit or production activity.
8. Energy Intensity
Measures energy consumption against an appropriate business denominator.
For example:
Energy intensity = Total energy consumed ÷ Revenue or production output
9. Energy Savings
Measures energy saved through efficiency initiatives such as efficient machinery, building upgrades, process optimisation and digital controls.
10. Water Consumption
Measures total water withdrawn or consumed by the organisation.
Water KPIs are particularly important for water-intensive industries and operations located in water-stressed regions.
11. Water Intensity
Measures water consumption relative to business activity.
Examples include:
- Litres per product
- Kilolitres per tonne of production
- Water consumption per ₹ crore revenue
12. Waste Generated
Measures the total quantity of waste produced.
Companies can further classify waste into:
- Hazardous waste
- Non-hazardous waste
- Recyclable waste
- Organic waste
- Electronic waste
13. Waste Recycling Rate
Measures the percentage of waste diverted from disposal through recycling, reuse or recovery.
Formula:
Recycled Waste ÷ Total Waste × 100
14. Waste-to-Landfill
Tracks the amount of waste sent to landfill.
A declining landfill ratio can indicate progress toward circular economy objectives.
15. Hazardous Waste
Measures the quantity of hazardous waste generated and the proportion safely treated or disposed of.
This KPI is particularly relevant for chemicals, pharmaceuticals, manufacturing, mining and healthcare businesses.
16. Environmental Incidents
Tracks environmental incidents such as:
- Chemical spills
- Oil spills
- Pollution events
- Regulatory breaches
- Significant environmental accidents
17. Environmental Compliance
Measures the number or value of environmental regulatory violations, notices, penalties and corrective actions.
18. Sustainable Procurement
Measures the proportion of procurement expenditure or suppliers meeting defined environmental or sustainability criteria.
19. Biodiversity Impact
For companies whose operations significantly affect land, ecosystems or natural resources, biodiversity-related indicators can measure:
- Land affected
- Restoration activities
- Protected areas affected
- Habitat restoration
- Biodiversity management programmes
20. Climate-Related Capital Expenditure
Measures capital deployed toward climate-related opportunities or risk mitigation.
Examples include:
- Renewable energy
- Energy-efficient equipment
- Electric vehicles
- Low-carbon technologies
- Climate-resilient infrastructure
Climate-related capital deployment is also among the cross-industry climate metric categories identified by IFRS S2.
Social KPIs
21. Total Employees
Tracks total workforce size and provides the baseline for many other workforce indicators.
22. Employee Turnover Rate
Measures the percentage of employees leaving the organisation during a reporting period.
Formula:
Employees Leaving ÷ Average Employees × 100
A high turnover rate may indicate problems involving compensation, leadership, workplace culture or career development.
23. Employee Engagement Score
Measures employee satisfaction, commitment and engagement through structured surveys.
24. Employee Training Hours
Measures the average number of training and development hours per employee.
25. Training Expenditure
Measures investment in employee learning and development.
It can be reported as:
- Total training expenditure
- Training expenditure per employee
- Training expenditure as a percentage of payroll
26. Gender Diversity
Measures the proportion of women in the workforce.
Companies can also track female representation by:
- Total workforce
- Management
- Senior management
- Board
- Technical positions
27. Gender Pay Gap
Measures differences in average remuneration between male and female employees.
The company should clearly define the methodology used.
28. Workplace Injury Rate
Measures the frequency of workplace injuries.
Possible indicators include:
- Total recordable injuries
- Lost-time injuries
- Lost-time injury frequency rate
- Injury severity rate
29. Fatalities
Tracks work-related fatalities among employees and, where relevant, contractors.
This is one of the most important health and safety indicators.
30. Occupational Health and Safety Training
Measures the percentage of employees and contractors receiving relevant health and safety training.
31. Absenteeism Rate
Measures employee absence from work.
A consistently high absenteeism rate may require management attention.
32. Human Rights Incidents
Tracks reported or confirmed human-rights violations associated with the company’s operations or value chain.
33. Supplier Social Compliance
Measures the percentage of suppliers assessed against social criteria such as:
- Labour standards
- Human rights
- Health and safety
- Child labour
- Forced labour
- Working conditions
34. Employee Benefits Coverage
Measures the percentage of employees receiving defined benefits such as:
- Health insurance
- Retirement benefits
- Parental leave
- Life insurance
- Wellness programmes
35. Community Investment
Measures expenditure or resources devoted to community development programmes.
For Indian companies, CSR spending should be tracked separately from broader ESG performance because CSR and ESG are not identical concepts.
36. Customer Complaints
Tracks customer complaints and their resolution.
Important indicators include:
- Number of complaints
- Complaint rate
- Resolution time
- Repeat complaints
- Customer satisfaction
37. Data Privacy Incidents
Measures significant customer or employee data privacy incidents.
This KPI is increasingly important for technology, financial services, healthcare and digital businesses.
38. Product Safety Incidents
Tracks safety-related incidents involving products or services.
Possible indicators include:
- Product recalls
- Safety complaints
- Regulatory notices
- Product-related injuries
- Corrective actions
39. Customer Satisfaction
Measures customer experience through indicators such as:
- Customer satisfaction score
- Net Promoter Score
- Retention rate
- Complaint resolution rate
40. Social Impact
Where appropriate, companies can measure outcomes from programmes related to:
- Education
- Healthcare
- Livelihood
- Skill development
- Financial inclusion
- Community development
The focus should be on measurable outcomes rather than merely reporting expenditure.
Governance KPIs
41. Board Independence
Measures the proportion of independent directors on the board.
This can help investors assess the strength of independent oversight.
42. Board Diversity
Tracks board composition by relevant diversity characteristics permitted and appropriate under applicable law.
43. Board ESG Oversight
Measures whether sustainability responsibilities have been formally assigned to:
- Board
- Board committee
- ESG committee
- Risk committee
- Senior management
44. Ethics and Anti-Corruption Training
Measures the percentage of employees and relevant business partners receiving ethics, anti-bribery and anti-corruption training.
45. Confirmed Corruption Incidents
Tracks confirmed incidents of corruption or bribery and associated disciplinary or legal actions.
46. Whistleblower Complaints
Measures:
- Number of complaints
- Cases investigated
- Cases substantiated
- Average resolution time
- Corrective actions
A strong whistleblower system should encourage reporting without retaliation.
47. Regulatory Fines and Penalties
Tracks significant fines and penalties related to regulatory or legal non-compliance.
48. ESG Data Assurance Coverage
Measures the percentage of material ESG information subject to internal review, external assurance or other verification procedures.
This becomes increasingly important as ESG reporting moves toward more rigorous assurance.
49. Executive Remuneration Linked to ESG
Measures the proportion of executive remuneration linked to sustainability or climate-related performance.
IFRS S2 specifically identifies the portion of executive management remuneration linked to climate-related considerations as one of its cross-industry climate metric categories.
50. ESG Target Achievement Rate
Measures the percentage of ESG targets achieved during the reporting period.
For example:
Targets achieved ÷ Total applicable ESG targets × 100
This is one of the most useful management KPIs because it connects ESG commitments with actual performance.
How Should Companies Select ESG KPIs?
A company should not attempt to report every possible ESG indicator.
The better approach is to identify KPIs that are material, relevant, measurable and decision-useful.
A practical five-step process is:
Step 1: Identify Material ESG Issues
Conduct a materiality assessment and identify the environmental, social and governance issues most relevant to the business.
Step 2: Link KPIs With Business Risks
Each important ESG risk should have measurable indicators.
For example:
Climate risk → GHG emissions + energy intensity + climate-related capital expenditure
Employee risk → turnover + engagement + safety incidents
Governance risk → whistleblower cases + compliance violations + anti-corruption training
Step 3: Establish a Baseline
A company should establish a reliable baseline year before setting reduction or improvement targets.
Step 4: Set Targets
Targets should specify:
- KPI
- Baseline year
- Target year
- Target value
- Interim milestones
- Responsible department
IFRS S1 requires relevant information about targets, including the metric used, target value, time period, base period, milestones, performance and changes to targets.
Step 5: Monitor and Report
ESG KPIs should become part of the regular management reporting system rather than being prepared only once a year for an ESG report.
ESG KPI Dashboard for Management
A practical ESG dashboard could contain:
| ESG Area | KPI | Frequency |
|---|---|---|
| Environmental | Scope 1 emissions | Monthly |
| Environmental | Scope 2 emissions | Monthly |
| Environmental | Scope 3 emissions | Quarterly |
| Environmental | Renewable energy % | Monthly |
| Environmental | Energy intensity | Monthly |
| Environmental | Water consumption | Monthly |
| Environmental | Waste recycling % | Monthly |
| Social | Employee turnover | Monthly |
| Social | Training hours | Quarterly |
| Social | Gender diversity | Quarterly |
| Social | Injury frequency | Monthly |
| Social | Employee engagement | Annual/Semi-annual |
| Governance | Whistleblower cases | Quarterly |
| Governance | Compliance violations | Monthly/Quarterly |
| Governance | ESG target achievement | Quarterly |
| Governance | ESG assurance coverage | Annual |
ESG KPIs and Financial Performance
ESG KPIs should not operate separately from financial KPIs.
Management should increasingly connect ESG indicators with:
- Revenue
- Operating costs
- Capital expenditure
- Working capital
- Cash flows
- Asset values
- Cost of capital
- Insurance costs
- Financing availability
- Customer retention
- Employee productivity
For example, reducing energy consumption can lower operating costs. Reducing employee turnover can reduce recruitment and training costs. Better supplier management can reduce operational disruption. Climate-risk investment can protect long-term assets.
This connection between sustainability information and financial prospects is central to the investor-focused ISSB approach. IFRS S1 focuses on sustainability-related risks and opportunities that could reasonably be expected to affect cash flows, access to finance or cost of capital over the short, medium or long term.
ESG KPIs for Indian Companies
Indian companies should consider applicable requirements under the regulatory framework relevant to them, including SEBI’s BRSR/BRSR Core requirements where applicable.
SEBI introduced BRSR Core as a focused set of KPIs intended to improve the reliability of ESG disclosures, with a phased applicability framework for listed entities.
Therefore, companies should distinguish between:
Mandatory regulatory KPIs
and
Management KPIs
and
Voluntary sustainability KPIs.
A KPI should not be selected simply because it makes the company’s ESG performance look attractive. It should be selected because it is relevant and capable of being measured consistently.
Role of CA and CMA Professionals in ESG KPIs
CA and CMA professionals can play an important role in designing and managing ESG KPI systems.
Their responsibilities can include:
- Designing ESG measurement frameworks.
- Establishing data controls.
- Connecting ESG KPIs with financial information.
- Developing ESG dashboards.
- Reviewing calculations.
- Supporting BRSR reporting.
- Monitoring ESG budgets.
- Measuring carbon-related costs.
- Supporting internal audit.
- Preparing management reports.
- Supporting ESG assurance readiness.
- Linking ESG performance with business strategy.
Management accountants, in particular, can help translate ESG indicators into financial and operational consequences.
10 Questions Every CFO Should Ask About ESG KPIs
Before approving an ESG dashboard, the CFO should ask:
- Are these KPIs material to our business?
- Who owns each KPI?
- Where does the data come from?
- Can the data be independently verified?
- Are the definitions consistent year after year?
- Can we reconcile important ESG data with financial and operational records?
- Are our emission calculations based on documented methodologies?
- Are ESG targets supported by budgets and capital allocation?
- Are we reporting both positive and negative performance?
- Will the information withstand external assurance?
These questions help prevent ESG reporting from becoming merely a marketing exercise.
Common Mistakes in ESG KPI Reporting
Companies should avoid:
- Tracking too many KPIs without prioritisation
- Changing definitions every year
- Reporting only favourable indicators
- Ignoring negative trends
- Using unsupported estimates
- Failing to document methodologies
- Setting targets without budgets
- Reporting targets without baselines
- Mixing different reporting periods
- Ignoring industry-specific risks
- Treating ESG KPIs as purely non-financial information
- Making claims that cannot be supported by evidence
The ISSB framework emphasises information that is comparable, verifiable, timely and understandable, and requires companies to consider materiality when determining what information to disclose.
Conclusion
ESG KPIs are the measurement engine of a company’s sustainability strategy.
A strong ESG programme does not require companies to measure everything. It requires them to measure the right things consistently.
The 50 KPIs discussed in this article provide a practical starting framework covering emissions, energy, water, waste, employees, safety, diversity, human rights, customers, governance, ethics, compliance, ESG targets and assurance.
The next stage is to connect these indicators with business strategy, budgets, enterprise risk management and financial performance.
For companies preparing for increasingly structured ESG reporting, the objective should be clear:
Measure what matters. Control the data. Set credible targets. Track progress. Explain performance.
That is how ESG moves from a reporting exercise to a genuine business-management system.